Agent View
The site as an AI agent gets it, beside the site as a person sees it. What it can read, what it has to cut away, and what it never sees.
-- Synthetic reference only. Run in a fresh PostgreSQL test session. -- TEMP objects disappear with the session; never load this into production. CREATE TEMP TABLE dashboard_params ( start_date date, end_date date, refund_before date, tenant_id text, currency text ); INSERT INTO dashboard_params VALUES ('2026-09-01','2026-09-05','2026-09-05','A','USD'); CREATE TEMP TABLE dashboard_orders ( id integer PRIMARY KEY, tenant_id text, ordered_on date, status text, currency text, region text, gross_cents integer ); INSERT INTO dashboard_orders VALUES (101,'A','2026-09-01','paid','USD','North',12000), (102,'A','2026-09-02','paid','USD','North',8000), (103,'A','2026-09-02','paid','USD','South',6000), (104,'A','2026-09-03','cancelled','USD','South',9000), (105,'A','2026-09-03','paid','USD','North',4000), (106,'A','2026-10-01','paid','USD','North',50000), (107,'A','2026-09-01','paid','EUR','North',7000), (108,'B','2026-09-01','paid','USD','North',90000); CREATE TEMP TABLE dashboard_refunds ( id integer PRIMARY KEY, order_id integer, refunded_on date, amount_cents integer ); INSERT INTO dashboard_refunds VALUES (1,101,'2026-09-02',1000), (2,101,'2026-09-03',500), (3,103,'2026-09-03',600), (4,101,'2026-10-01',2000); CREATE TEMP VIEW dashboard_base AS WITH refunds_per_order AS ( SELECT r.order_id, SUM(r.amount_cents) AS refund_cents FROM dashboard_refunds r CROSS JOIN dashboard_params p WHERE r.refunded_on < p.refund_before GROUP BY r.order_id ) SELECT o.id, o.ordered_on, o.region, o.gross_cents - COALESCE(r.refund_cents,0) AS net_cents FROM dashboard_orders o CROSS JOIN dashboard_params p LEFT JOIN refunds_per_order r ON r.order_id = o.id WHERE o.tenant_id = p.tenant_id AND o.currency = p.currency AND o.status = 'paid' AND o.ordered_on >= p.start_date AND o.ordered_on < p.end_date; -- Q1: KPI cards: net_cents=27900, orders=4, average_order_cents=6975.00 SELECT COALESCE(SUM(net_cents),0) AS net_cents, COUNT(*) AS orders, ROUND(SUM(net_cents)::numeric / NULLIF(COUNT(*),0),2) AS average_order_cents FROM dashboard_base; -- Q2: Daily chart: Sep01=10500, Sep02=13400, Sep03=4000, Sep04=0 WITH calendar AS ( SELECT generate_series(p.start_date::timestamp, (p.end_date-1)::timestamp, interval '1 day')::date AS day FROM dashboard_params p ) SELECT c.day, COALESCE(SUM(b.net_cents),0) AS net_cents, COUNT(b.id) AS orders FROM calendar c LEFT JOIN dashboard_base b ON b.ordered_on = c.day GROUP BY c.day ORDER BY c.day; -- Q3: Regional table: North=22500/3 orders; South=5400/1 order SELECT region, SUM(net_cents) AS net_cents, COUNT(*) AS orders, ROUND(SUM(net_cents)::numeric / COUNT(*),2) AS average_order_cents FROM dashboard_base GROUP BY region ORDER BY region;
-- Synthetic reference only. Run in a fresh PostgreSQL test session. -- TEMP objects disappear with the session; never load this into production. CREATE TEMP TABLE dashboard_params ( start_date date, end_date date, refund_before date, tenant_id text, currency text ); INSERT INTO dashboard_params VALUES ('2026-09-01','2026-09-05','2026-09-05','A','USD'); CREATE TEMP TABLE dashboard_orders ( id integer PRIMARY KEY, tenant_id text, ordered_on date, status text, currency text, region text, gross_cents integer ); INSERT INTO dashboard_orders VALUES (101,'A','2026-09-01','paid','USD','North',12000), (102,'A','2026-09-02','paid','USD','North',8000), (103,'A','2026-09-02','paid','USD','South',6000), (104,'A','2026-09-03','cancelled','USD','South',9000), (105,'A','2026-09-03','paid','USD','North',4000), (106,'A','2026-10-01','paid','USD','North',50000), (107,'A','2026-09-01','paid','EUR','North',7000), (108,'B','2026-09-01','paid','USD','North',90000); CREATE TEMP TABLE dashboard_refunds ( id integer PRIMARY KEY, order_id integer, refunded_on date, amount_cents integer ); INSERT INTO dashboard_refunds VALUES (1,101,'2026-09-02',1000), (2,101,'2026-09-03',500), (3,103,'2026-09-03',600), (4,101,'2026-10-01',2000); CREATE TEMP VIEW dashboard_base AS WITH refunds_per_order AS ( SELECT r.order_id, SUM(r.amount_cents) AS refund_cents FROM dashboard_refunds r CROSS JOIN dashboard_params p WHERE r.refunded_on < p.refund_before GROUP BY r.order_id ) SELECT o.id, o.ordered_on, o.region, o.gross_cents - COALESCE(r.refund_cents,0) AS net_cents FROM dashboard_orders o CROSS JOIN dashboard_params p LEFT JOIN refunds_per_order r ON r.order_id = o.id WHERE o.tenant_id = p.tenant_id AND o.currency = p.currency AND o.status = 'paid' AND o.ordered_on >= p.start_date AND o.ordered_on < p.end_date; -- Q1: KPI cards: net_cents=27900, orders=4, average_order_cents=6975.00 SELECT COALESCE(SUM(net_cents),0) AS net_cents, COUNT(*) AS orders, ROUND(SUM(net_cents)::numeric / NULLIF(COUNT(*),0),2) AS average_order_cents FROM dashboard_base; -- Q2: Daily chart: Sep01=10500, Sep02=13400, Sep03=4000, Sep04=0 WITH calendar AS ( SELECT generate_series(p.start_date::timestamp, (p.end_date-1)::timestamp, interval '1 day')::date AS day FROM dashboard_params p ) SELECT c.day, COALESCE(SUM(b.net_cents),0) AS net_cents, COUNT(b.id) AS orders FROM calendar c LEFT JOIN dashboard_base b ON b.ordered_on = c.day GROUP BY c.day ORDER BY c.day; -- Q3: Regional table: North=22500/3 orders; South=5400/1 order SELECT region, SUM(net_cents) AS net_cents, COUNT(*) AS orders, ROUND(SUM(net_cents)::numeric / COUNT(*),2) AS average_order_cents FROM dashboard_base GROUP BY region ORDER BY region;No <main>: Wrap the page’s own content in <main>, so a reader knows where it starts and stops, and Clean can be measured. No h1: Give each one h1 that says what the page is.
The figures
90 pages, set against the 167,893 sites with figures.
- Readablehigher is better
- 100%90 of 90 pages
- All 167,893 sitesBetter than 47%
Pages whose own text is in the HTML the server sends, enough of it for their kind.
- Cleanhigher is better
- 93%middle page
- All 167,893 sitesBetter than 91%
Of the words before script, the share that are the page and not menus, footer and forms. 11 pages are not measured, with no <main> or no words.
- Costshown, never scored
- 244,794tokens
- About 2,720 a page
To read every page once. A long page that answers well is not worse for it. Tokens are estimated at about 4 characters each.
How its pages spread on Clean
70 pages measured. Not measured: 11 with no <main> or no words.
Against its rivals
The sites nearest it by what they do, with figures. Close means similar work, not better.
| Readinghigher is better | Costnot scored | ||
|---|---|---|---|
| Site | Readable | Clean | Tokens a page |
| askyourdatabase.comThis site, 90 pages | 100% | 93% | 2,720 |
| forem.com100 pages | 98% | 75% | 1,966 |
| dqc.ai100 pages | 96% | 44% | 876 |
| itpathsolutions.com100 pages | 98% | 96% | 6,200 |
First of 4 on Readable, second on Clean.
AI crawler access
What robots.txt says to each, as read on October 24, 2026. 8 of 8 may read the site.
| Crawler | robots.txt says | Used for | The line that decides |
|---|---|---|---|
| GPTBotOpenAI | Not named | Training models | Falls to User-agent: * |
| OAI-SearchBotOpenAI | Not named | ChatGPT search | Falls to User-agent: * |
| ChatGPT-UserOpenAI | Not named | A page a person asks about | Falls to User-agent: * |
| ClaudeBotAnthropic | Not named | Training models | Falls to User-agent: * |
| Claude-SearchBotAnthropic | Not named | Claude’s search | Falls to User-agent: * |
| PerplexityBotPerplexity | Not named | Perplexity search | Falls to User-agent: * |
| Google-ExtendedGoogle | Not named | Training Gemini | Falls to User-agent: * |
| bingbotMicrosoft | Not named | Bing and Copilot | Falls to User-agent: * |
Every AI crawler mttr checks may read it. Not named means the rules for every crawler apply.
Every page
Worst first. Each opens in Agent View at the top.
19 pages of 81 lose something. Pick a loss to see what to do about it.Open the action plan
| What an agent getshigher is better | Signals | Costnot scored | ||||
|---|---|---|---|---|---|---|
| Page | Words | Clean | Readable | Main heading | Tokens | What it loses |
| /resources/sql-server-latest-status-example.sql | 142 | No <main> | Yes | None | 291 | No <main> and 1 more |
| /seo/ai-database-query/reference.sql | 243 | No <main> | Yes | None | 581 | No <main> and 1 more |
| /seo/crm-pipeline/reference.sql | 189 | No <main> | Yes | None | 349 | No <main> and 1 more |
| /seo/mysql-gui/session-timezone.sql | 115 | No <main> | Yes | None | 214 | No <main> and 1 more |
| /seo/natural-language-rollout/reference.sql | 144 | No <main> | Yes | None | 353 | No <main> and 1 more |
| /seo/postgresql-report/reference.sql | 142 | No <main> | Yes | None | 380 | No <main> and 1 more |
| /seo/sql-dashboard/reference.sql | 248 | No <main> | Yes | None | 670 | No <main> and 1 more |
| /seo/sql-query-generator/join-aggregation.sql | 143 | No <main> | Yes | None | 264 | No <main> and 1 more |
| /seo/text-to-sql-evaluation/fixture.sql | 95 | No <main> | Yes | None | 285 | No <main> and 1 more |
| /seo/text-to-sql/reference.sql | 95 | No <main> | Yes | None | 245 | No <main> and 1 more |
| /seo/warehouse-sql-routing/definition-change.sql | 145 | No <main> | Yes | None | 256 | No <main> and 1 more |
| /chatbot-pricing | 141 | 53% | Yes | None | 280 | No h1 |
| /desktop-pricing | 79 | 53% | Yes | None | 127 | No h1 |
| /docs/v1.1.136 | 110 | 63% | Yes | None | 281 | No h1 |
| /docs/v1.1.135 | 107 | 64% | Yes | None | 265 | No h1 |
| /docs/v1.1.121 | 166 | 71% | Yes | None | 304 | No h1 |
| /docs/v1.1.124 | 166 | 72% | Yes | None | 337 | No h1 |
| /docs/v1.1.13 | 204 | 73% | Yes | None | 446 | No h1 |
| /docs/connect | 583 | 89% | Yes | None | 1,370 | No h1 |
| /business-info | 28 | 17% | Yes | Yes | 54 | Nothing |
| /contact | 112 | 51% | Yes | Yes | 203 | Nothing |
| /docs/sample-db | 97 | 61% | Yes | Yes | 270 | Nothing |
| /about-us | 247 | 67% | Yes | Yes | 517 | Nothing |
| /docs/webhook | 310 | 82% | Yes | Yes | 628 | Nothing |
| /docs/chatbot-db-switching | 412 | 84% | Yes | Yes | 982 | Nothing |
Show where it stands
A card, a badge and a line, each with the figures.
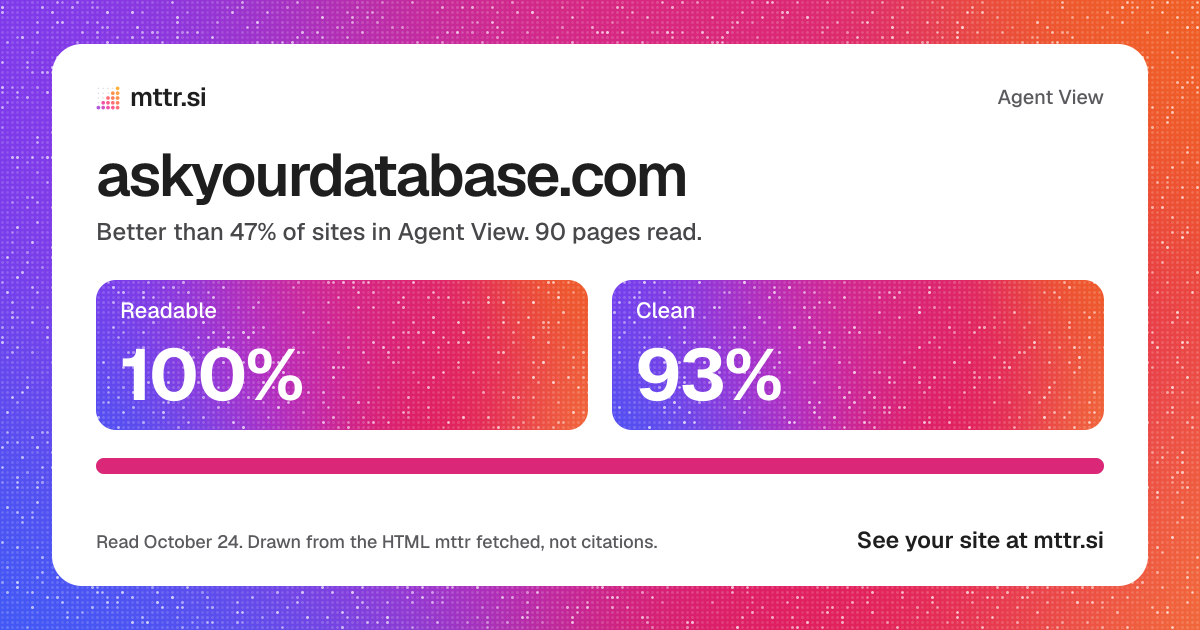
A badge for the site

<a href="https://mttr.si/agent-view/askyourdatabase.com"><img src="https://mttr.si/agent-view/askyourdatabase.com/badge.svg" alt="Agent View: 100% readable, 93% clean" height="20"></a>
The figures in one line
askyourdatabase.com in Agent View: 100% of pages readable, better than 47% of sites; 93% clean; 244,794 tokens to read all 90 pages. mttr.si/agent-view/askyourdatabase.com
What to do next
Fix the pages, let an agent do it, and read the site again to see the figures move.
Fix what agents miss
- Give 19 pages a main headingClearer
- Wrap 11 pages in <main>Clean measured
Connect your agent
Claude Code, Codex or Cursor reads the site’s fixes over MCP, fixes a page in your code, has mttr read it again, and checks the fix landed.
https://mttr.si/mcpSet up an agent
Claim the site
Prove it is yours with a DNS record or a file. Your agent can then reach its reads and jobs, and set each change to wait for your approval.
Claim the siteDrawn from the HTML mttr fetched on its read of October 24, 2026, not a screenshot, and only from the 90 pages read. An assistant’s own reader may differ. Tokens are estimated at about 4 characters each. A site an agent reads well is not a site an assistant cites.